Scatter Plot
1.) To enter scatter plot view, navigate to a collection with multiple structures and click  at the bottom-right as shown below, and select
2.) Once in scatter plot view, you can choose which score terms to plot on the X and Y axes.
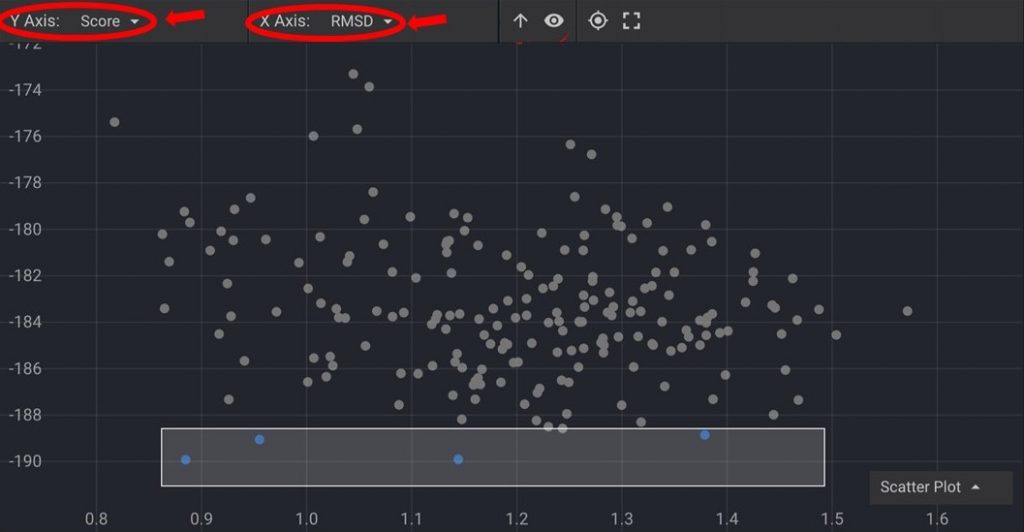
3.) You can select the points you’d like to get a closer look at, and press  to select these in the table above. Selecting desired structures and pressing
  will make those structures visible in the viewer, once you switch back to mode.
4.) Zoom in and out with the same controls as the structure viewer. Pressing  will bring all points into view.